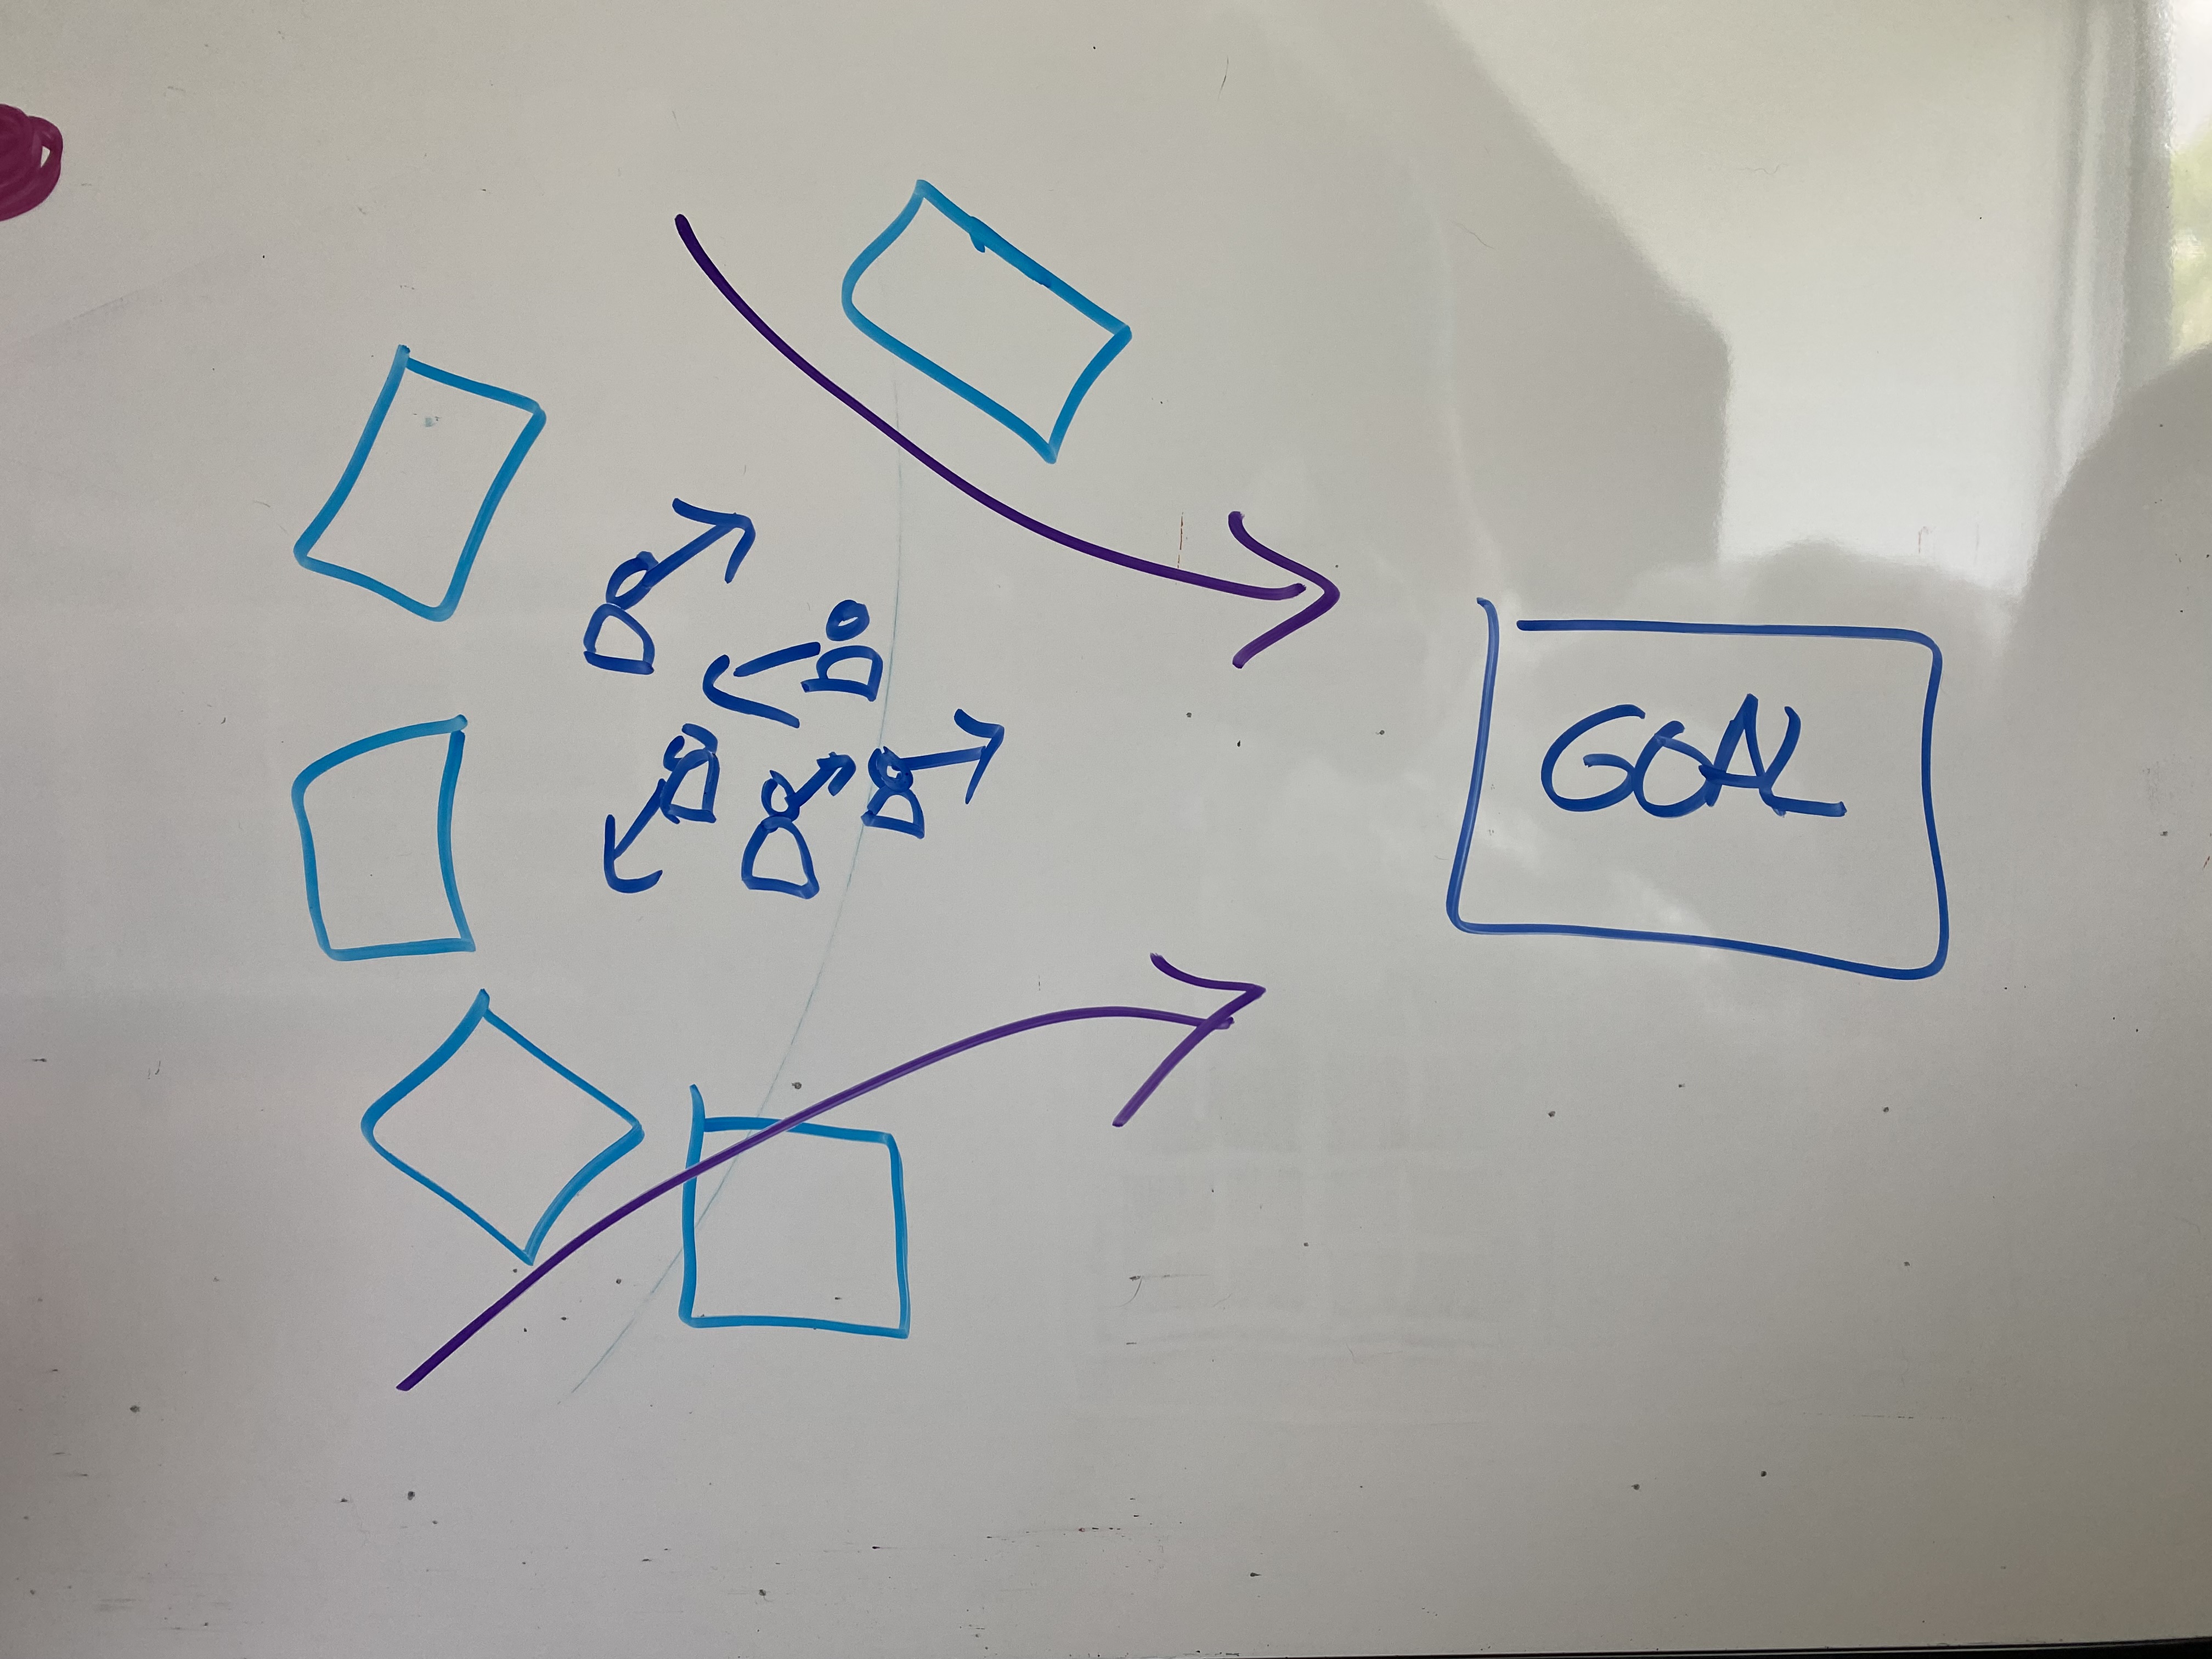
Operations
Operations is the management of processes that produce and deliver products or services.
Operational Visibility Systems
Dashboards and reporting systems make system state, progress, and performance visible across teams and leadership.
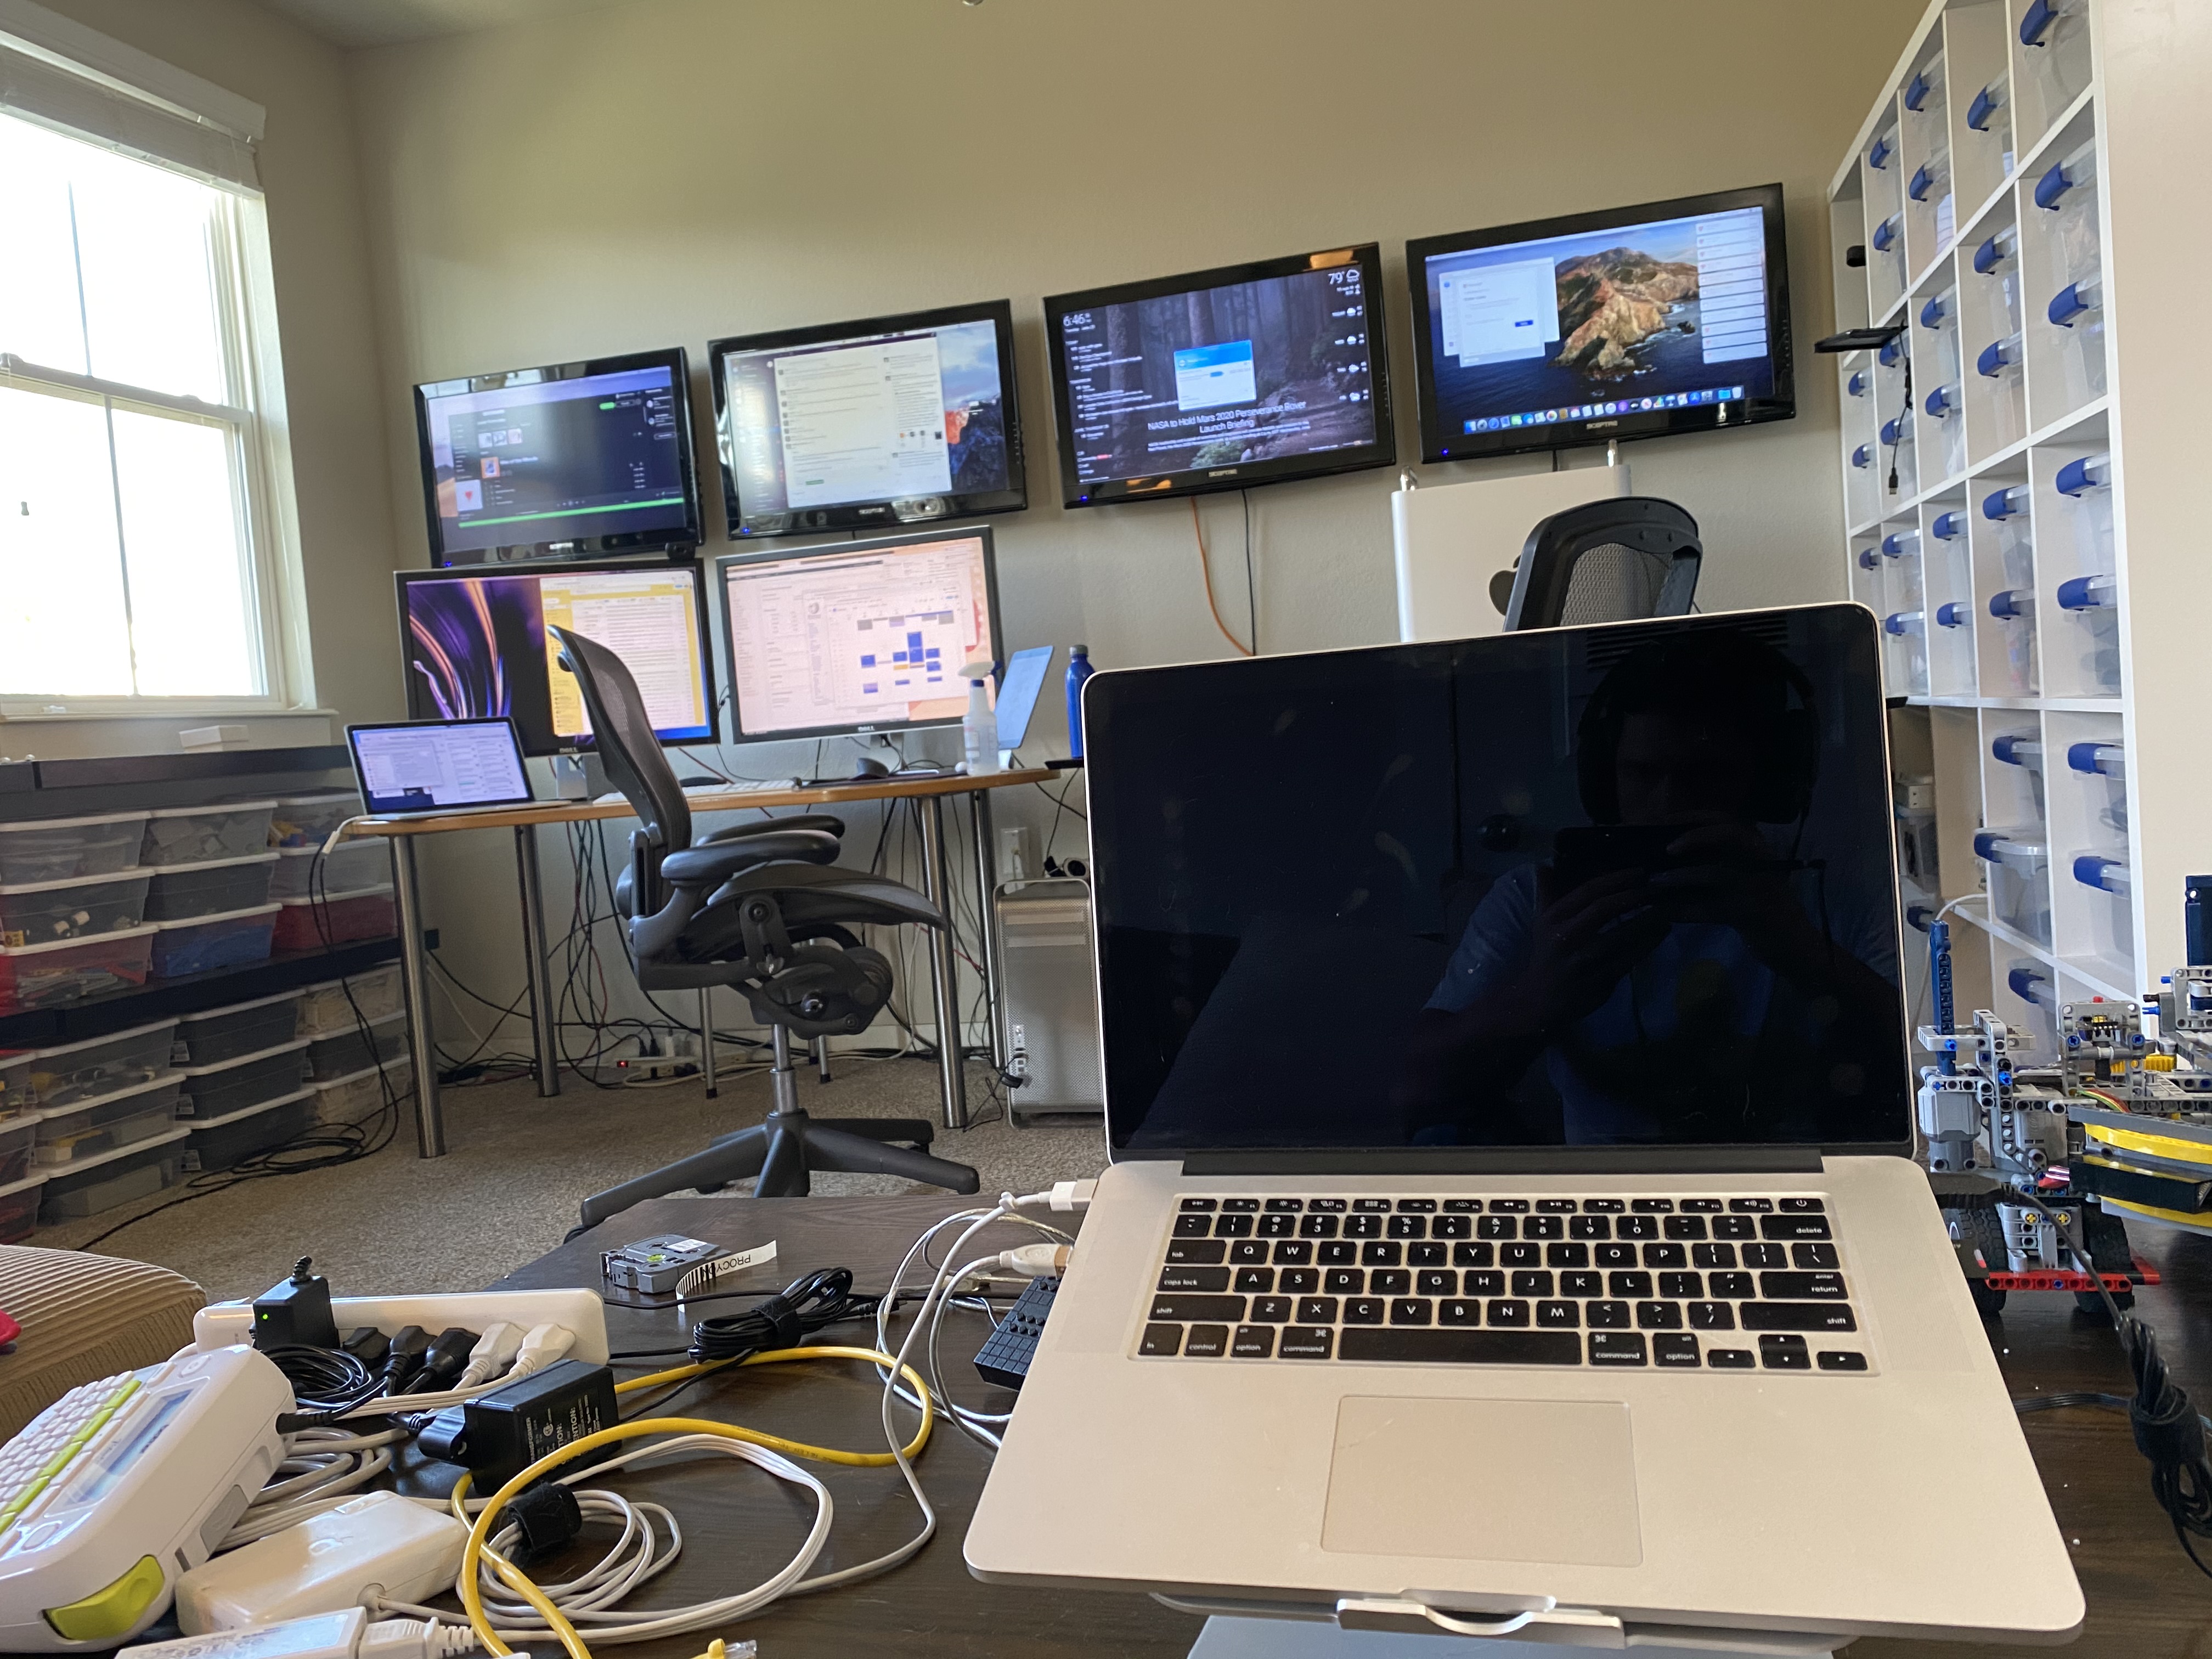
Dashboards and reporting systems make system state, progress, and performance visible across teams and leadership.
This domain is valuable because coordination problems become visible here. It clarifies who decides, what gets measured, where resources flow, how incentives align or drift, and how feedback changes behavior over time.
The transfer is practical. Once you can read incentives and coordination costs in one organization or market, you get faster at diagnosing why other systems stall, scale, or move in the wrong direction. This domain gets more useful when it is compared with adjacent systems instead of being treated as a silo. That is where reusable judgment starts to form.
Operations is the management of processes that produce and deliver products or services.
Business Intelligence is a technologies and practices for analyzing business data to support strategic decisions.

Tableau is a data visualization and business intelligence platform.
Apache Druid is a real-time analytics database optimized for fast queries.

My calendar is one of the primary ways I make commitments visible and real.
Tableau scorecards and cycle-time dashboards for a mortgage lender that had never measured its production teams — where the hard part was defining the metrics, not drawing the charts.
This page documents the tools I use to observe patterns in my life, health, work, time, money, and behavior.
A mortgage-industry data processing company I built Tableau scorecards and cycle-time dashboards for.